Tuesday, December 16, 2014

ICTER 2014 Invited Talk: Large Scale Data Processing in the Real World: from Analytics to Predictions

Last week I did an invited talk at ICTER 2015 conference in colombo, discussing "Big Data", and following are the slides.


Abstract

Large scale data processing analyses and makes sense of large amounts of data. Although the field itself is not new, it is finding many usecases under the theme "Bigdata" where Google itself, IBM Watson, and Google's Driverless car are some of success stories. Spanning many fields, Large scale data processing brings together technologies like Distributed Systems, Machine Learning, Statistics, and Internet of Things together. It is a multi-billion-dollar industry including use cases like targeted advertising, fraud detection, product recommendations, and market surveys. With new technologies like Internet of Things (IoT), these use cases are expanding to scenarios like Smart Cities, Smart health, and Smart Agriculture. Some usecases like Urban Planning can be slow, which is done in batch mode, while others like stock markets need results within Milliseconds, which are done in streaming fashion. There are different technologies for each case: MapReduce for batch processing and Complex Event Processing and Stream Processing for real-time usecases. Furthermore, the type of analysis range from basic statistics like mean to complicated prediction models based on machine Learning. In this talk, we will discuss data processing landscape: concepts, usecases, technologies and open questions while drawing examples from real world scenarios.

Tuesday, December 2, 2014

Short Introduction to Realtime Analytics with Big Data: What, Why, How?

An updated version of the post is found at A Gentle Introduction to Stream Processing.

What and Why of Realtime Analytics?


I am sure you have heard enough about Big Data, the idea of “processing data and extracting actionable insights from data”. Most Big Data applications use batch processing technologies like Hadoop or Spark, which will need us to store data in a disk and later process them.

Batch processing often takes few minutes to generate an output, and with large datasets, it can take hours. However, there are lot of use cases where it is much useful to know results faster.

For example, think about traffic data collected from counting vehicles at each traffic light. We can use Hadoop or Spark to analyze this data. Among useful insights can be “traffic hotspots”, “traffic trends over time” etc. It is interesting to know after a one hour, there was traffic in “US-101”. On the other hand, It is much more useful to know there is traffic now, so one could avoid it.

There are lot and lot of use cases like this where outcome is important and there is a chance that we can act to fix if there is a problem. Following are few of them.
  1. Algorithmic Trading
  2. Smart Patient Care
  3. Monitoring a production line
  4. Supply chain optimisations
  5. Intrusion, Surveillance and Fraud Detection
  6. Most Smart Device Applications : Smart Car, Home ..  
  7. Smart Grid
  8. Vehicle and Wildlife tracking
  9. Sport analytics
  10. Context aware promotions and advertising

Realtime analytics let you analyze data as they come in and make important decisions within milliseconds to few seconds.

How to do Realtime Analytics?

OK, great how can we do real time analytics?

Lets start with an example. Let us say you want to know how many visitors and in your site and be notified if there are more than 10000 visitors came in within last 30 minutes. However, you want to know that the condition has met right away.

Whenever visitor do something in your site, it sends events that looks like following. Ignore the syntax for now, but read what it means.

define stream SiteVistors(ts long, email string, url string)

Try 1: People first tried to do this by optimizing Hadoop having lot of processing nodes. With lot of machine and tuning you can bring down Hadoop job execution time to few seconds. This, however, is like trying to do your water supply using buckets instead of pipes. Chances are that it will break when 1) you change your query a bit, 2) when data has grown, or 3) when two batch jobs run at the same time. Also not to mention you will be using about 10X hardware than you will need.

For example, to do our use case, we would need to run Hadoop on last 30 minutes of data to count the number of visits, and likely we will have to run it back to back  starting another run once a run has completed.

Try 2: Google had the same problem, and they solved it with Dremel (which later made available as “Big Query”). Dremel let you issue queries over a large set of data and get responses within few seconds by breaking up and processing data using several machines in parallel. If you want this technology, Apache Drill is an opensource implementation of the idea.

Try 3: You can do this faster via In-Memory computing. Idea is to have lot of memory, load pr keep all the data to memory (do compressions and cool algorithms like Sketching when possible), and process the data. Since data is in memory, it will be much faster. For more information, please checkout a white paper and the slide deck I have done about the topic.

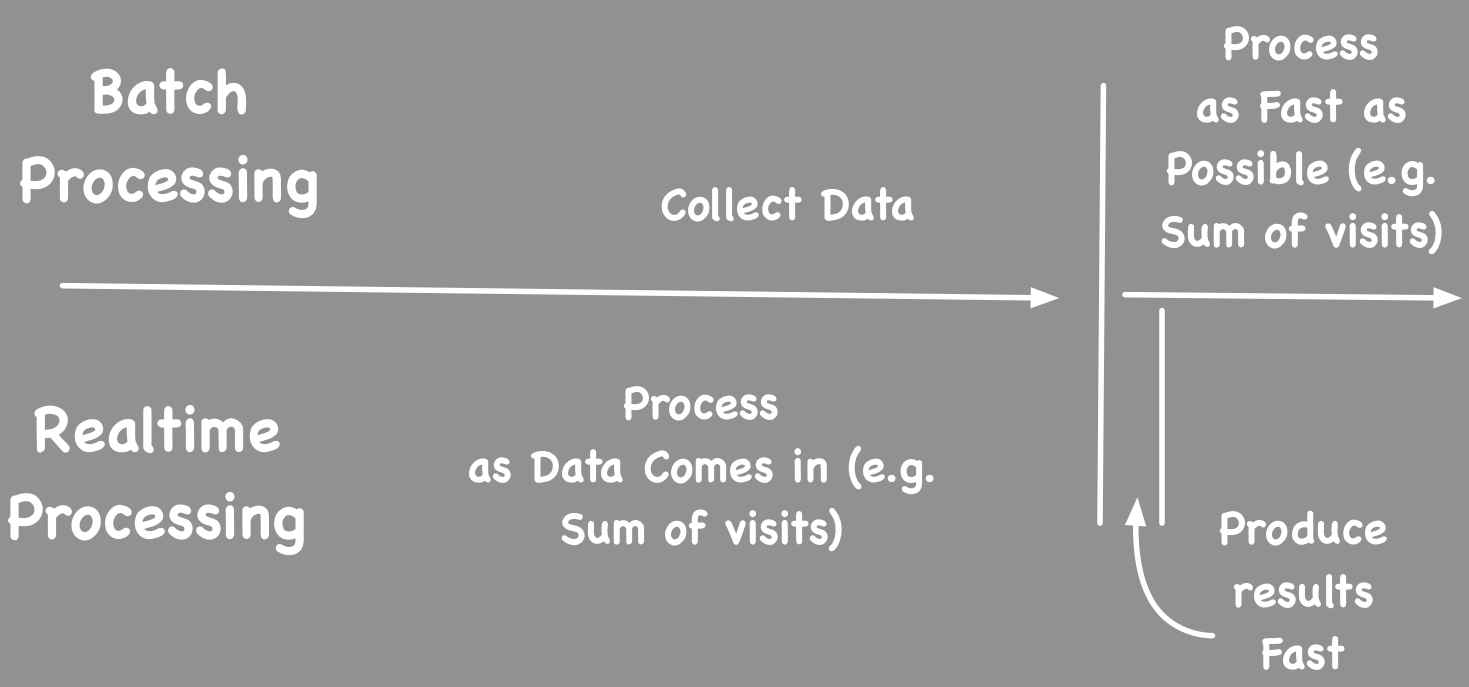
However, all above three are ways to make batch processing faster. Batch processing would just collect data for a period of time, and only try to process data when all the data has been received. Basically, we sit idle for first 30 minutes just collecting data and try to do it as fast as possible when 30 minutes has passed.

From that perspective, it is a bad idea to use batch processing to do this. There is much better way to do this. Idea is to process data as they come in, and that way once we have all the data, we can produce the results right away.

BatchVsRealtimeSample.png

Such technology (called Stream Processing) has been around for more than 10 years and used in use cases like Stock trading. Main idea is to create a graph of processing nodes (each can be stateful) and data get processed as they flow through the graph. (e.g. IBM InfoStreams, Tibco Stream Base).

Fast forward to now, we have two classes of technologies to do this now: Stream Processing (e.g. Apache Storm) and Complex Event Processing (e.g. WSO2 CEP, Esper).

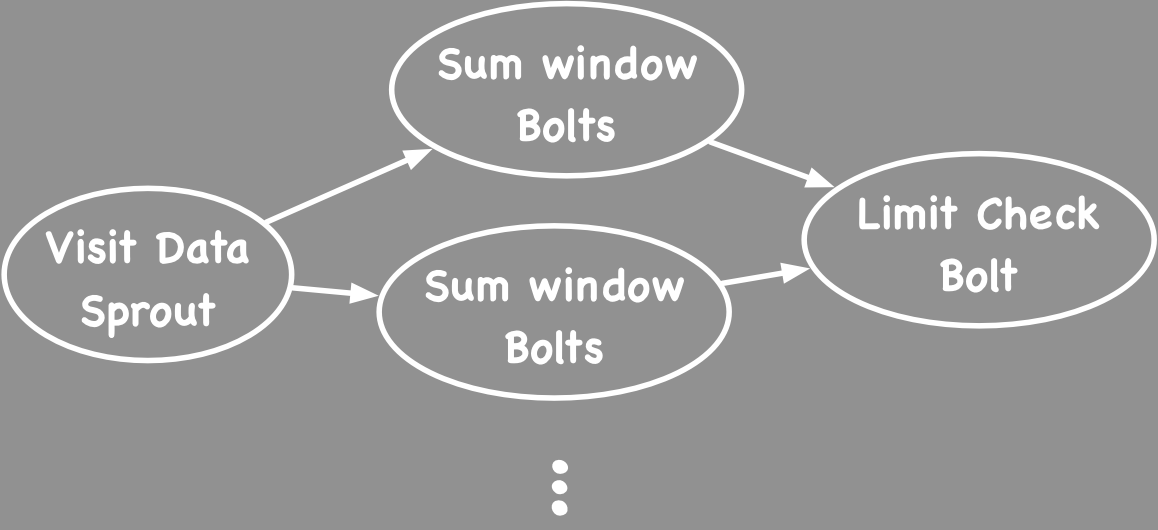
Think of Apache Storm as Hadoop for Streaming data. Idea is you write code for processing nodes called Bolts and wire them up to a graph called topology. Storm will keep this topology running. In our example, several processing nodes will track sum of visits for a given window of time and one master node can receive sums from other nodes and check sum of those sums for a condition ( for more info about code, see Word Count with Storm).

StromExample1.png

Great, then why Complex Event Processing? It is best explained through an analogy. You may have heard about Hive, which is a SQL on top of Hadoop (MapReduce). With Hadoop, you can write java code and get something done, but with Hive you can write an SQL query to get the most of the same things done. Latter is simpler and lot of people understand SQL.

Think of Complex Event Processing (CEP) as SQL on top of Storm. (Well technically there are deep differences, if you want to get to it, see 1 and 2). However, with over the time both technologies has shared more and more features. If you are a programmer, CEP would look like SQL on top of Storm. For example, see SQLStream samples http://www.sqlstream.com/examples/ and also WSO2 CEP 4.0 version, which will run your CEP query on top of Storm.)

For example our example on top of CEP will be look like following.

from SiteVistors#window.timeBatch[30m]
select email, sum(url) as sum
having sum > 10000

Here #window.timeBatch[30m] says collect data in 30 minute window and process the query. If you want processing to be done in parallel with many machines, the query will look like following.

//define the partition
define partition SiteVistorsParition SiteVistors.email;

//process data within partition
from ParitionedSiteVistors#window.timeBatch[30m]
select email, sum(url) as sum
insert into SiteVistorsSums;
using partition SiteVistorsParition;

//sum up the sums and check
from SiteVistorsSums#window.timeBatch[1s]
select sum(sum) as fsum
having fsum > 10000

Just like Hive, CEP technologies has lot of operators that you can directly use like Filters, Joins, Windows, and Event Patterns. See my earlier post for more details.

Conclusion

So we discussed what is Realtime analytics, Why we need it, and How to do it. Real Time analytics has lot of use cases that are very hard to implement with MapReduce style batch processing, and trying to make such use cases faster using MapReduce often eat up resources.

Having said that technologies like Apache Drill and Isolutions like SAP Hana have their own use case, which is interactive ad-hoc analytics. For Stream processing to work, you must know queries a priori.  If you want to do ad-hoc queries, you need to use technologies like Apache Drill. So there are three types of use cases and you need use different solutions for each.

  1. Batch Processing - MapReduce, Sprak
  2. Real time analytics when queries are known a priori - Stream Processing
  3. Interactive Ad-hoc queries - Apache Drill, Hazecast, SAP Hana

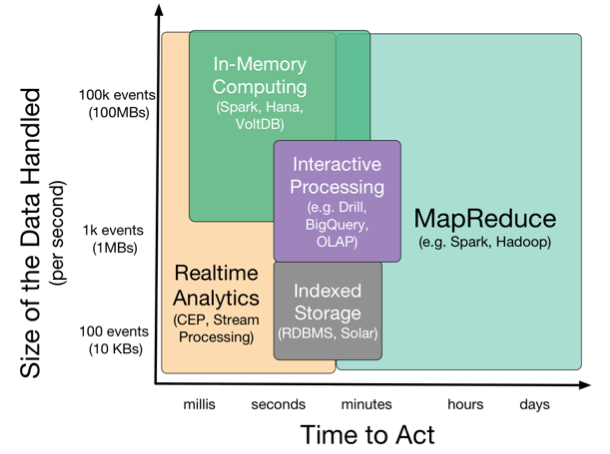
Following Picture Summaries different tools and requirements.

Y axis is amount of data (in size or as number of events), and X axis is time taken to produce the results. It outlines when each technology is useful.

Update 2017 September: You can try out above sample queries and ideas with WSO2 Stream Processor, which is freely available under Apache Licence 2.


Hope this was useful. If you enjoyed this post you might also like Stream Processing 101: From SQL to Streaming SQL and Patterns for Streaming Realtime Analytics


Thursday, July 24, 2014

Handling Large Scale CEP Usecase with WSO2 CEP

I have been explaining the topic too many times in last few days and decided to write this down. I had written down my thoughts on the topic earlier on the post How to scale Complex Event Processing? This posts covers how to do those on WSO2 CEP and what will be added in upcoming WSO2 CEP 4.0 release. 
Also I will refine the classification also a bit more with this post. As I mentioned in the earlier post, scale has two dimensions: Queries and data streams. Given scenario may have lot of streams, lot of queries, complex queries, very large streams (event rate), or any combination those. Hence we have four parameters and the following table summarises some of useful cases.


Size of Stream
Number of Stream
Size of Queries
Number of Queries
How to handle?
Small Small Small Small 1 CEP or 2 for HA.
Large Small Small Small Stream needs to be partitioned
Small Large Small Large Front routing layers and back end processing layers. Run N copies of queries as needed
Large X X X Stream needs to be partitioned
X X Large X Functional decomposition + Pipeline or a combination of both


Do you need to scale?


WSO2 CEP can handle about 100k-300k events/sec. That is about 26 Billion events per day.  For example, if you are a Telecom provider, and if you have a customer base of 1B (Billion) users (whole world has only 6B), then each customer has to take 26 calls per day. 
So there isn't that many use cases that need more than this event rate. Some of the positive examples would be monitoring all emails in the world, some serious IP traffic monitoring, and having 100M Internet of things (IoT) devices that sends an event once every second etc. 
Lets assume we have a real case that needs scale. Then it will fall into one of the following classes. (These are more refined versions of categorised I discussed in the earlier post)
  1. Large numbers of small queries and small streams 
  2. Large Streams 
  3. Complex Queries

Large number of small queries and small streams


As shown by the picture, we need to place queries (may be multiple copies) distributed across many machines, and then place a routing layer that directs events to those machines having queries that need those events. That routing layer can be a set of CEP nodes. We can also implement that using a pub/sub infrastructure like Kafka. This model works well and scales.

Large Streams (high event rate)


As shown in the picture, we need a way to partition large streams such that the processing can run independently within each partition. This is just like MapReduce model which needs you to figure out a way to partition the data (this tutorial explains MapReduce details). 
To support this sceanrio, Siddhi language let you define partitions. A sample query would looks like following. 

define partition on Palyer.sid{
    from Player#window(30s)select avg(v)as v insert into AvgSpeedByPlayer;
}

Queries defined within the partitions will be executed separately.  We did something similar for the first scenario of the DEBS 2014 Grand challenge solution. From the next WSO2 CEP 4.0.0  release onwards, WSO2 CEP can run different partitions on different nodes. (With WSO2 CEP 3.0, you need to do this manually via a routing layer.) If we cannot partition the data, then we need a magic solution as described in next section.

Large/Complex Queries (does not fit within one node)


Best example of a complex query is the second scenario of the DEBS 2014 Grand Challenge that includes finding median over 24 hour window that involves about 700 million events within the window! 
Best chance to solve this class of problems is to setup a pipeline as I explained in my earlier post. If that does not work, we need decompose the query into many small sub queries. Talking to parallel programming expert (serious MPI guy might help you, although domains are different, same ideas work here.) This is the domain of experts and very smart solutions.
Most elegant answers comes in the form of Distributed Operators (e.g. Distributed Joins see http://highlyscalable.wordpress.com/2013/08/20/in-stream-big-data-processing/). There are lot of papers on SIGMOD and VLDB describing algorithms for some of the use cases. But they work on some specific cases only. We will eventually implement some of those, but not in this year. Given a problem, often there is a way to distribute the CEP processing, but frameworks would not help you.
If you want to do #1 and #2 with WSO2 CEP 3.0, you need to set it up yourself. It is not very hard.  (If you want to do it, drop me a note if you need details). However, WSO2 CEP 4.0 that will come out in 2014 Q4 will let you define those scenarios using the Siddhi Query Language with annotations on how many resources (nodes) to use. Then WSO2 CEP will create queries, deploy them on top a Storm cluster that runs a Siddhi engine on each of it's bolt, and run it automatically.
Hopefully, this post clarifies the picture. If you have any thoughts or need clarification, please drop us a note.

Friday, June 20, 2014

Glimpse of the future: Overlaying realtime analytics on Football Broadcasts

At WSO2con Europe (http://eu14.wso2con.com/agenda/), which concluded Wednesday, we did a WSO2 CEP Demo, which as very well received.  We used events generated from a real football game, calculated a bunch of analytics using WSO2 CEP (http://wso2.com/products/complex-event-processor/), annotated the game with information, and run it side by side with the real game’s video.


The original dataset and video was provided as part of 2013 DEBS grand challenge by ACM Distributed Event based Systems conference. 

Each payer had sensors in his shoes, goalie had two more in his gloves, and ball also had a sensor. Each sensor emits events in 60Hz where a event had sensorID, time stamp, x,y,z locations, velocity and acceleration vectors.

The left hand panel visualizes the game on 2D in sync with game running on right hand side and other panels show analytics like, successful vs. failed passes, ball possession, shots on goal, running speed of players, etc. Furthermore, we wrote queries to detect offsides and annotate them on 2D panel.  Slide deck at  http://www.slideshare.net/hemapani/analyzing-a-soccer-game-with-wso2-cep says how we (Dilini, Mifan,  Suho, myself and others) did this.

I will write more details soon, and if you want to know more or get the code, please let me know.

Now we have technology to augment your sport viewing experience. In few years, how we watch a game will be much different.  


Friday, May 30, 2014

ACM DEBS Grand Challenge 2014: Smart grids, 4 Billion events, throughout in range of 100Ks

ACM Distributed Event Based Systems (DEBS) happened at Mumbai this week. One of the highlight of the conference is DEBS Grand Challenge. 

Introduced at 2011, and happening for the forth time, the grand challenge poses a real world data set and a set of problems that would keep distributed event enthusiastic busy for few months. Selected solutions are invited to the conference, and final showdown and announcement happen at the conference. 

2013 challenge includes a football (soccer) game, which I blogged earlier. 2014 challenge is an smart metering use case, timely one given the advent of IoT, that included 4B (yes with a capital B) events collected over 6 weeks from 40 houses and 2000 sensors. You can find more details from http://www.cse.iitb.ac.in/debs2014/?page_id=42. (also Zbigniew Jerzak, The DEBS 2014 Grand Challenge, ACM Distributed Event based System, 2014)

In 2014 challenge, four solutions were accepted out of about 25 submissions: from Dresden University of Technology (Germany), Imperial College London, Fraunhofer Institute (Germany), and WSO2.   

Problem involves two queries: predicting load and finding outlier sensors. The predicting algorithm is given, as this is a event-processing challenge, not an machine learning challenge. Both queries needed a single node solution as well as a distributed solution. 

First query was easy to parallelize, and all four solutions had completed this successfully, posting single node throughputs of few thousands up to 300k and 400K events per second. Scaling first query turns out to be much trickier, and solutions had posted throughput of  0.85M with 4 nodes, 1.7 with 6 nodes, 1.1 with 50 nodes (events per second).

Second query includes a median calculated over 24 hour sliding window, with about 1000 events per second. This means about 74million events and calculated over sliding window sliding in 1 second. This had everyone swearing. Single node solutions gave throughputs ranging from few 100k to few millions. 

Distributed solution for query two, well no one had it solved. All distributed solutions were slower than the single node solution. Obviously, there are lot more work to be done by the community at large. 

There was stiff competition and everyone was at their toes though the presentations. Overall winner was solution from Fraunhofer Institute (#3) and audience award went to Imperial College London (#2).

It was lot of fun, and among my parting thought was "If 40 houses generate 4B events, how we are going to handle millions of houses?" 

You can find our presentation from slideshare and paper from "Solving the grand challenge using an opensource CEP engine". I will write a detailed blog about our solution soon. Other solutions presentations and papers are available in ACM library


Solving DEBS Grand Challenge with WSO2 CEP from Srinath Perera


Looking forward to the next year DEBS grand challenge. 

Sunday, May 11, 2014

Why throughput reduces when going though an ESB?

Often we measure the overhead of an ESB by first hitting the backend service directly measuring throughput and latency, and then going though an ESB and comparing the two. Often, latency is higher and throughput is lesser when going though an ESB.

Going via ESB means an additional network hop, so everyone agrees that latency must be increased. But why throughput reduces?

Question has troubled us for a long time, and Paul described the answer in http://pzf.fremantle.org/2012/09/understanding-esb-performance.html. Simple gist of the answer is that ESB do twice IO (it reads, sends to backend server, reads the response, and sends it back as oppose to backend server who just reads and responds to the messages). Hence, if the backend is very fast (if it just reads the message and responds), though ESB throughput will be around 50%.

Now, what if backend service is slow? E.g. add 80ms sleep to the backend service. It turns out even then the throughput has decreased. In this case, the client uses many threads (e.g. 20). Each thread sends a request, waits for a response to come back, and then sends the next request. E.g. If you use some load client like JMeter or Apache Bench, this is what happening. (This is the Saturation Test as Paul explained).

Reduction of throughput is caused due to following reason.

  1. Lets say that when we hit backend service, it takes time t ms. 
  2. When go though ESB, latency will always be more than going direct. Lets say it takes t+2ms. 
  3. Since client sends one message after the other, in the direct case it will send 1000/t messages. 
  4. Mediating though ESB client will only send 1000/(t+2) messages. 
  5. So the throughput of the to direct case is always higher than via ESB case if you use a client that wait for response to come before sending the next message. 
  6. Applying this to some numbers: let us assume latencies are 99ms vs. 111ms directly and though ESB respectively. Then the throughput should be 300 vs 267. 


What is the problem? Since we use few clients, then the delay in response affect how many messages are put to the system. However, a real usecase is different. Then, you will have thousands to millions of clients that send requests randomly without sending requests one after the other in lockstep. In such cases (e.g. simulated test as Paul explained), the same problem does not arise.

 Alternatively you can write a client that sends the next request in a fix time regardless of how long the response will take.

Thursday, March 27, 2014

Implementing Bigdata Lambda Architecture using WSO2 CEP and BAM

Most real world Bigdata use cases involve both stream processing (real-time) processing as well as batch processing. To address both the concerns Nathan Marz introduced an architecture style called “Bigdata Lambda architecture”.

Following figure shows the outline of Lambda Architecture that includes batch, speed, and serving layers. Incoming data are sent to both batch and speed layers, where batch layer pre-calculates a historical view of the system and speed layer calculates the most recent view of the system. The sensing layer combines the two layers to satisfy the given queries.


You can find more information about Lambda Architecture from following.
  1. Big Data Lambda Architecture
  2. The Lambda architecture: principles for architecting realtime Big Data systems
  3. Applying the Big Data Lambda Architecture 
Following picture shows how we can implement the lambda architecture using WSO2 Products.


As the picture depicts, you can use WSO2 BAM to implement the batch layer and WSO2 CEP to implement speed layer. We send incoming data to both BAM and CEP using high performance data transport called "Data bridge" that can achieve throughput upto 300,000 events/second. BAM run user defined Hive queries to calculate the batch views and CEP runs user define CEP queries to calculate the runtime views. Then we can combine the both the views using “Event tables” in WSO2 CEP, which maps the batch views in a database into CEP windows, to answer the queries posed by the users.

For example, the next figure shows how to implement the following query using lambda architecture. You can find more information in my Strata talk.

“If velocity of the ball after a kick is different from season average by 3 times of season’s standard deviation, trigger event with player ID and speed”

Here we combine CEP and BAM to answer the query.


Wednesday, March 26, 2014

WSO2Con Talk: Accelerating Mobile Development with Mobile Enterprise Application Platforms (MEAP)


Following are the slides for my wso2con talk about upcoming MEAP product. This talk describes WSO2 MEAP, a product that let users develop and manage the complete lifecycle of mobile application development. MEAP includes support for both Mobile App development and back end service development as well.


You can download the slides from here.